A client is searching for ways to curate and document data in order to obtain data lineage. The client has a data source connected to a data lake.
Which tool should the consultant recommend to meet the client's requirements?
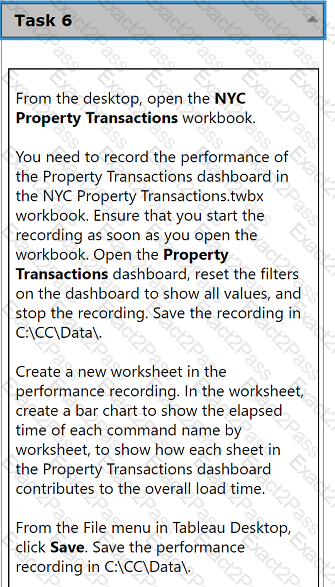
From the desktop, open the NYC
Property Transactions workbook.
You need to record the performance of
the Property Transactions dashboard in
the NYC Property Transactions.twbx
workbook. Ensure that you start the
recording as soon as you open the
workbook. Open the Property
Transactions dashboard, reset the filters
on the dashboard to show all values, and
stop the recording. Save the recording in
C:\CC\Data\.
Create a new worksheet in the
performance recording. In the worksheet,
create a bar chart to show the elapsed
time of each command name by
worksheet, to show how each sheet in
the Property Transactions dashboard
contributes to the overall load time.
From the File menu in Tableau Desktop,
click Save. Save the performance
recording in C:\CC\Data\.
Use the following login credentials to sign in
to the virtual machine:
Username: Admin
Password:
The following information is for technical
support purposes only:
Lab Instance: 40201223
To access Tableau Help, you can open the
Help.pdf file on the desktop.
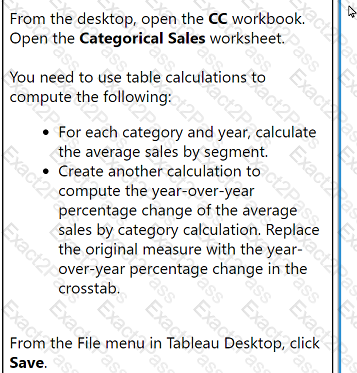
From the desktop, open the CC workbook.
Open the Categorical Sales worksheet.
You need to use table calculations to
compute the following:
. For each category and year, calculate
the average sales by segment.
. Create another calculation to
compute the year-over-year
percentage change of the average
sales by category calculation. Replace
the original measure with the year-
over-year percentage change in the
crosstab.
From the File menu in Tableau Desktop, click
Save.
From the desktop, open the CC workbook.
Open the City Pareto worksheet.
You need to complete the Pareto chart toshow the percentage of sales compared tothe percentage of cities. The chart mustshow references lines to visualize how thedata compares to the Pareto principle.
From the File menu in Tableau Desktop, clickSave.
From the desktop, open the CC workbook.
Open the Manufacturers worksheet.
The Manufacturers worksheet is used to
analyze the quantity of items contributed by
each manufacturer.
You need to modify the Percent
Contribution calculated field to use a Level
of Detail (LOD) expression that calculates
the percentage contribution of each
manufacturer to the total quantity.
Enter the percentage for Newell to the
nearest hundredth of a percent into the
Newell % Contribution parameter.
From the File menu in Tableau Desktop, click
Save.
From the desktop, open the CCworkbook. Use the US PopulationEstimates data source.
You need to shape the data in USPopulation Estimates by using TableauDesktop. The data must be formatted asshown in the following table.
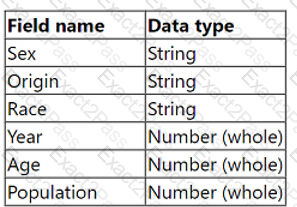
Open the Population worksheet. Enterthe total number of records contained inthe data set into the Total Recordsparameter.
From the File menu in Tableau Desktop,click Save.
A client has a large data set that contains more than 10 million rows.
A consultant wants to calculate a profitability threshold as efficiently as possible. The calculation must classify the profits by using the following specifications:
. Classify profit margins above 50% as Highly Profitable.
. Classify profit margins between 0% and 50% as Profitable.
. Classify profit margins below 0% as Unprofitable.
Which calculation meets these requirements?
From the desktop, open the CC workbook.
Open the Incremental worksheet.
You need to add a line to the chart that
shows the cumulative percentage of sales
contributed by each product to the
incremental sales.
From the File menu in Tableau Desktop, click
Save.
A client wants to see the average number of orders per customer per month, broken down by region. The client has created the following calculated field:
Orders per Customer: {FIXED [Customer ID]: COUNTD([Order ID])}
The client then creates a line chart that plots AVG(Orders per Customer) over MONTH(Order Date) by Region. The numbers shown by this chart are far higher
than the customer expects.
The client asks a consultant to rewrite the calculation so the result meets their expectation.
Which calculation should the consultant use?
A client uses Tableau Data Management and notices that when they view a data source, they sometimes see a different count of workbooks in the Connected
Workbooks tab compared to the lineage count in Tableau Catalog.
What is the cause of this discrepancy?
A client wants to report Saturday and Sunday regardless of the workbook's data source's locale settings.
Which calculation should the consultant recommend?
A client notices that while creating calculated fields, occasionally the new fields are created as strings, integers, or Booleans. The client asks a consultant if
there is a performance difference among these three data types.
What should the consultant tell the customer?
A client collects information about a web browser customers use to access their website. They then visualize the breakdown of web traffic by browser version.
The data is stored in the format shown below in the related table, with a NULL BrowserID stored in the Site Visitor Table if an unknown browser version
accesses their website.
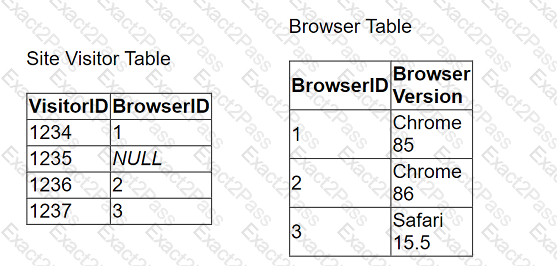
The client uses "Some Records Match" for the Referential Integrity setting because a match is not guaranteed. The client wants to improve the performance of
the dashboard while also getting an accurate count of site visitors.
Which modifications to the data tables and join should the consultant recommend?