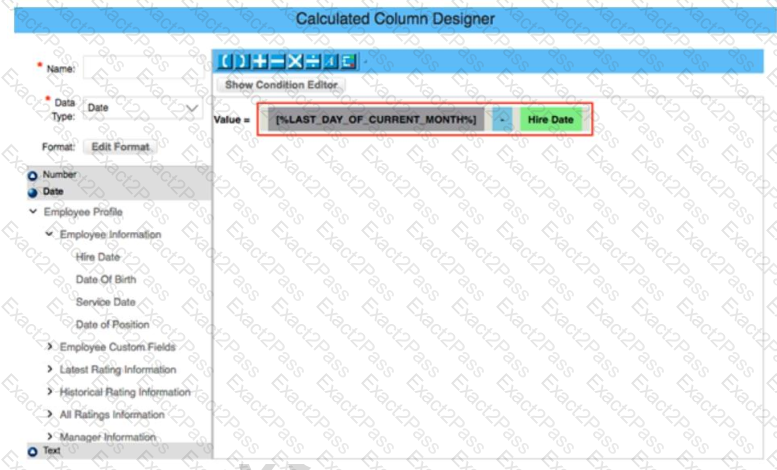
You are creating a calculated column to calculate an employee's organizational tenure. Why does the formula in the screenshot result in an error?
In a canvas report, to which of the following can you export multipage reports in a single transaction? Note: There are 3 correct answers to this question.
In a Story, which of the following would make it possible for a filter to update multiple charts using linked analysis? Note: There are 2 correct answers to this question.
In the Advanced Reporting tool, you want to create a query where the results meet the following criteria: Only show one row per employee, Only show the pay components Base Salary and Bonus, Show these pay components as individual columns. You have joined the Global Job Information table with the Compensation table.What else must you do? Note: There are 2 correct answers to this question.
What happens when you enable inline translation of a Story as it relates to future edits of the Story report? Note: There are 2 correct answers to this question.
What are the requirements for a custom block in People Profile to be reportable in a Story? Note: There are 2 correct answers to this question.
When constructing an expression for a calculated column in Query Designer, which syntax should you use to enter a date?
A user reports they are unable to successfully create a new Story report in Report Center. The page is stuck in a blank loading screen. How do you validate the user exists and has the proper configuration in the SAP Analytics Cloud Solution?
Why would you export report definitions? Note: There are 2 correct answers to this question.
You are creating a Story report on employment and compensation information. You have created two queries to support the story report. The table and the left chart are using an employment query as its data source. The right chart uses a compensation query as its data source. Both queries include the field for the employee Job Title. When you add an input control to the page, it only filters the table and the left chart. What action must you take to configure the input control to effect both charts and the table?
In Detailed Reporting, what functionality can be used in a calculated column? Note; There are 2 correct answers to this question.
You support report consumers. A report consumer asks if it is possible to save the selected items
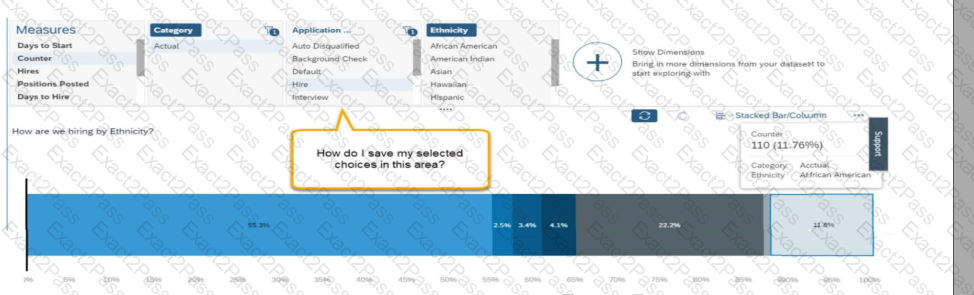
when viewing the detail of a chart in a story report (see screenshot).
How do you tell the report consumer to save the state? Note: There are 2 correct answers to this question.
In a live data query, what are user-prompted filter types? Note: There are 2 correct answers to this question.
You have a field in Job Information that stores the assignment of an employee to a Generic Object record for a Company Car Company Car records include an Assignment Date of the Car. You want to create a query that includes the Employee Information, and also include the Assignment Date of the Car. You add the Job Information Table toQuery Designer. What steps do you take to accomplish the query? Note; There are 2 correct answers to this question.
What features are available only when you use Business Intelligence and Reporting Tools (BIRT) with Table Reports? Note: There are 2 correct answers to this question.
Which actions can you permit the report consumer to perform by your configuration of interactive widgets? Note; There are 3 correct answers to this question.
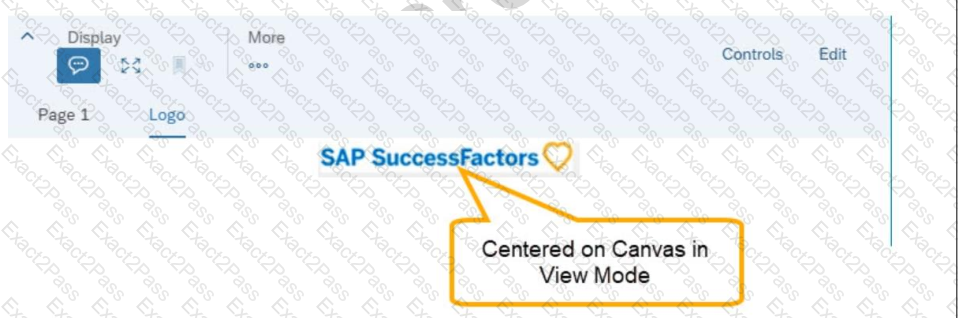
You are configuring a story report. You add the image widget to the top-left corner of the canvas. You then upload the SAP SuccessFactors logo in the Builder, and select the logo image so it displays on the canvas. When you preview the report in View Mode, the logo appears centered on the canvas. What action do you take so the Logo appears in the top-left corner when viewing the report in View Mode?
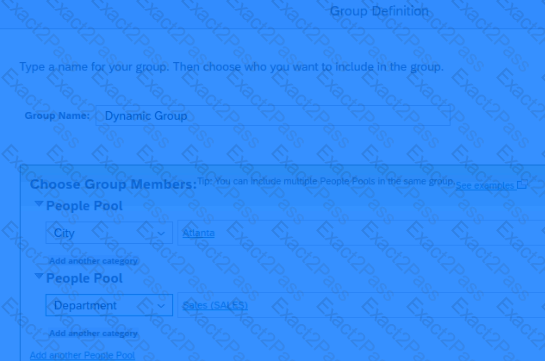
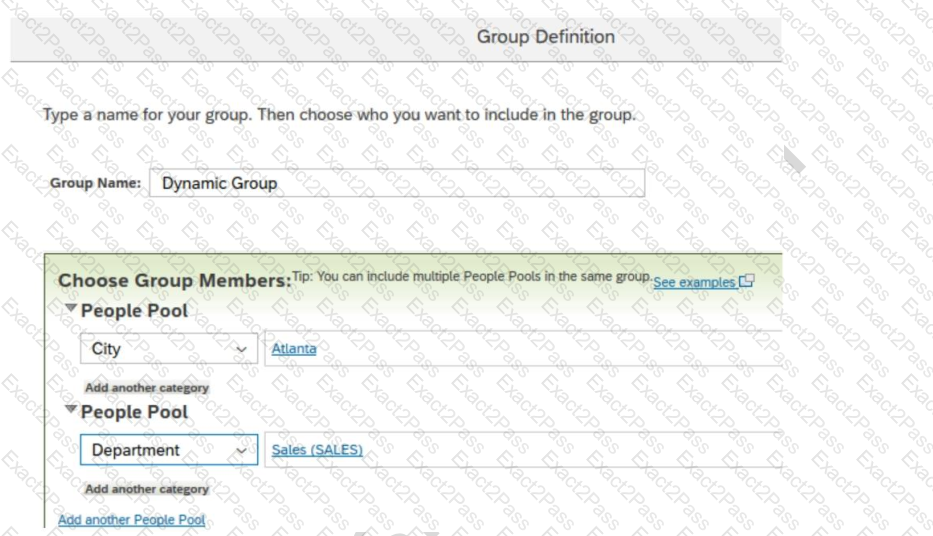
You are using Report Center to share a canvas report. You share the report with a Dynamic Group (see attached image). Who is the report shared with?
You want to create a page in a canvas report that includes a custom image, a user editable title centered underneath the image, and the current date in the top-right corner. Which combinations of components can you use to accomplish this? Note: There are 2 correct answers to this question.
User A creates a dashboard with four tiles. When User B accesses the dashboard, only three tiles are visible. Why can User B see only three tiles?